
St. Simons Island Real Estate Market Update: What Sellers Need to Know November 2026
St. Simons Island residential properties sold at a median price of $785,000 in October 2026, the highest monthly median of the past year. Homes sold faster, averaging 102 days on the market, and sellers received 97.0% of their final list price. The number of closed sales was lighter, though, and that part of the story matters too.
After 29 years in real estate, I can tell you accurate pricing is as important now as ever. With more than 300 homes for sale on St. Simons Island, buyers have choices, and they know what a home is worth. Pricing it right from the start is the best way to avoid extended days on market and multiple price reductions. In October, sellers who priced right got 97% of their asking price. Those who started high gave up about $42,000 along the way.
These figures are residential sales data for St. Simons Island from the MLS for the month of October 2026, and they include single-family homes, condos and townhomes. Starting next month, we will break out detached homes and condos/townhomes separately. Here is what it means if you are thinking about selling. If you missed last month, you can read the October 2026 market update.
What Happened in the St. Simons Island Real Estate Market in October 2026?
There were 33 residential closed sales reported in October, compared with 50 in October 2025 and 57 in September. That count is preliminary. These numbers were pulled on November 10, and a few late-reported closings may still be added.
The more useful signal is what went under contract. There were 42 pending sales in October, the same as October 2025 and one more than September. Pending sales today become closed sales over the next 30 to 60 days, so buyer demand looks steady heading into the holidays.
Are St. Simons Island Home Prices Going Up or Down?
October’s numbers point up. The median sold price was $785,000, up about 8% from $724,750 in October 2025 and up from $670,000 in September (September figures have been updated with late-reported sales). The average sold price was $880,546, up about 13% from $778,943 a year ago.
Keep the sample size in mind. With 33 sales, a handful of higher-priced closings can move the median quite a bit, so one strong month is not a trend on its own. What matters for your home is what has sold nearby, in your price range, in similar condition. That is why a St. Simons Island Listing Specialist prices from comparable sales rather than headlines.
How Long Are Homes Taking to Sell on St. Simons Island?
Homes that sold in October had been on the market an average of 102 days, down from 111 days in October 2025 and 117 days in September. That is the quickest pace since May. Homes priced correctly from the first day still tend to move faster than the average, and the ones that sit are usually the ones that started too high.
How Much Are Sellers Getting Compared to Asking Price?
Sellers received an average of 97.0% of their final list price in October, the strongest figure in the past 12 months and up from 96.2% a year ago. Measured against the original list price, the figure was 94.6%, which tells us many sellers still reduced their price before closing. On a $785,000 home, the gap between original asking price and sale price works out to roughly $42,000.
How Many Homes Are for Sale on St. Simons Island Right Now?
There were 334 active residential listings at the end of October, down from 365 in September and exactly even with 333 a year ago. New listings slowed to 68, the fewest since December 2025. Based on the MLS absorption rate, that is about 6.4 months of supply, compared with about 6.8 months a year ago and 7.1 months in September. Six to seven months is generally considered a balanced market, and October moved slightly toward sellers.
What Does This Mean for Sellers on St. Simons Island?
- Price it right from day one. Homes priced well are closing at 97% of list, while homes that started high gave up thousands in price cuts along the way.
- There is less competition right now. Inventory dropped by 32 homes from September, and fewer new listings are coming on the market.
- Do not wait for spring by default. Fewer homes compete for serious buyers over the winter. If you are weighing your timing, read Should You Wait Until Spring to Sell on St. Simons Island?
- Presentation still matters. Condition, photography, and staging separate the quick sales from the long ones. Here is how to prepare your St. Simons Island home for sale.
Frequently Asked Questions
Is it a good time to sell on St. Simons Island?
October was a solid month for sellers. Homes sold faster, sale prices came in closer to asking, and there were fewer competing listings than in September. The market is still balanced rather than one-sided, so pricing and presentation matter. The right timing also depends on your own plans.
What is the median home price on St. Simons Island?
The median sold price for residential properties (homes, condos and townhomes) on St. Simons Island was $785,000 in October 2026, according to the MLS. That is about 8% higher than October 2025.
How long does it take to sell a home on St. Simons Island?
In October 2026, residential properties that sold had spent an average of 102 days on the market, down from 111 days a year earlier.
How many homes are for sale on St. Simons Island?
There were 334 active residential listings, including homes, condos and townhomes, at the end of October 2026, according to the MLS.
Is St. Simons Island a buyer’s market or a seller’s market?
It is balanced. With about 6.4 months of supply, St. Simons Island sits near the line between a buyer’s and seller’s market, and October tilted slightly toward sellers compared with September.
The Bottom Line
October was a stronger month for St. Simons Island sellers: a higher median price, faster sales, the best sale-to-list ratio of the year, and fewer homes competing for buyers. Closed sales were lighter, but pending sales were up from last year. If you are planning to sell, the best next step is a price based on what has actually closed near your home.
About John Hallman
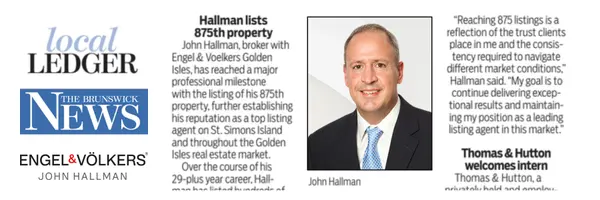
John Hallman is the St. Simons Island Listing Specialist with Engel & Völkers Golden Isles, with 29 years of experience and more than 875 properties personally listed on St. Simons Island and throughout the Golden Isles. Learn more about how to price your home on St. Simons Island or explore the best neighborhoods on St. Simons Island.
What Is Your Home Worth in Today’s Market?
Averages only go so far. If you want to know what your home would likely sell for, and how long it would take, request a free, no-obligation home valuation based on this month’s St. Simons Island sales.
Market data is for residential properties (single-family homes, condos and townhomes) on St. Simons Island from the local MLS for October 2026, retrieved November 10, 2026, and is deemed reliable but not guaranteed. October figures are preliminary. Closed sales reported late will be added and may change these numbers slightly. This is not an appraisal or a guarantee of future results.
Follow the St. Simons real estate market? Add me as a preferred source on Google to see more information from me in your searches.
I Want To See More Articles From John
Categories
Recent Posts





GET MORE INFORMATION

Listing Specialist & Real Estate Broker License ID: 182381